
Data Analysis
At Skaarvi Digitals, we help businesses turn raw data into clear, useful, and actionable insights through professional data analysis solutions. Businesses generate large amounts of information every day, but without proper organization and analysis, valuable insights can easily be missed. We help clean, format, organize, and analyze your business data to make it easier to understand and use. Our solutions can help you track business performance, monitor sales and leads, identify trends, and understand important performance indicators. We also create regular reports and interactive dashboards that present complex information in a simple and visual format. Whether you need daily, weekly, or monthly reporting, sales analysis, lead tracking, or business performance monitoring, Skaarvi Digitals helps you organize your data and turn it into meaningful information that supports better planning, faster decisions, and continuous business improvement.
Make Better Decisions With Smart Data Analysis
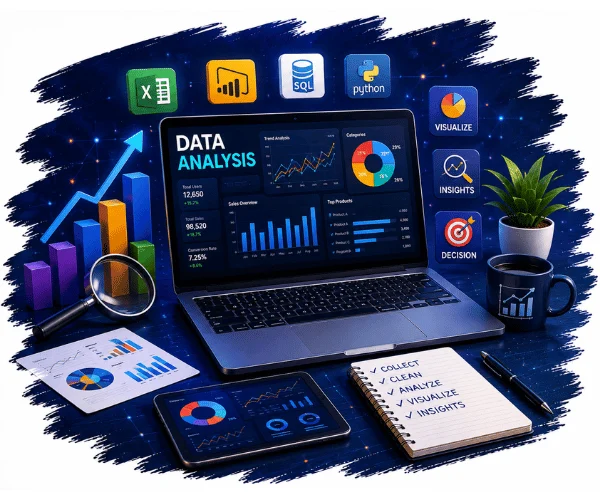
Data-Driven Business Insights
We help businesses understand their data through organized analysis, accurate reporting, and meaningful visualizations. Our approach transforms scattered or complex information into clear insights that can support better decision-making. From tracking daily activities to identifying sales trends and monitoring business performance, we make your data easier to understand, analyze, and use for practical business planning.
Our Data Analysis Services
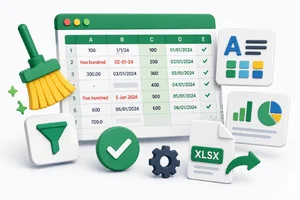
Data Cleaning & Formatting
We clean, organize, and format raw business data to improve its accuracy, consistency, and usability. We identify duplicate, missing, inconsistent, or incorrectly formatted information and organize the data into a structured format suitable for analysis and reporting.
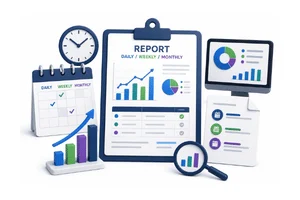
Report Creation
Get clear and organized business reports based on your required reporting frequency. We create Daily, Weekly, and Monthly reports that help you monitor important activities, understand performance trends, and keep track of business progress.
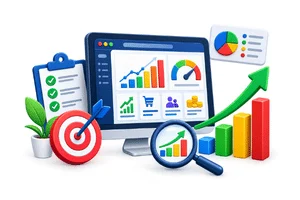
Business Performance Tracking
Monitor important business metrics and understand how your business is performing over time. We organize key performance information into easy-to-understand reports and dashboards, helping you identify progress, gaps, trends, and areas that may require attention.
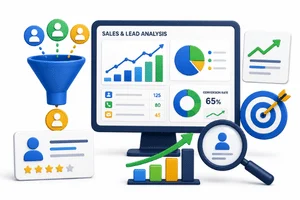
Sales & Lead Analysis
Understand your sales activities and lead performance through structured data analysis. We help track leads, conversions, sales trends, performance patterns, and other relevant information to provide better visibility into your sales process and customer acquisition activities.
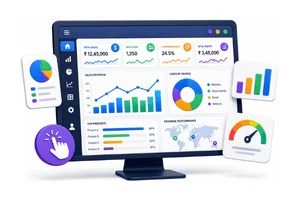
Interactive Dashboards
Turn complex business data into interactive and easy-to-understand dashboards. We create visual dashboards that allow you to view important metrics, compare performance, identify trends, and access key business information in a more convenient and meaningful way.
Why Skaarvi Digitals?
FAQ
We provide Data Cleaning & Formatting, Report Creation, Business Performance Tracking, Sales & Lead Analysis, and Interactive Dashboard solutions.
Data cleaning involves identifying and correcting issues such as duplicate, missing, inconsistent, or incorrectly formatted information and organizing the data into a usable structure.
Yes. We can create reports according to your preferred reporting frequency, including Daily, Weekly, and Monthly reports.
Yes. We can analyze sales data to identify trends, performance patterns, comparisons, and other useful business insights.
Yes. We can analyze lead data to help businesses understand lead volume, sources, conversion patterns, and overall lead performance.
Business performance tracking involves monitoring important business metrics over time to understand progress, identify trends, and find areas that may need improvement.
Interactive dashboards present business data visually through charts, tables, metrics, and filters, allowing users to explore and understand information more easily.
Yes. Dashboards can be customized according to your business metrics, data sources, reporting requirements, and preferred visual presentation.
Yes. We can work with available business data and help organize, clean, format, analyze, and present it in a more useful structure.